Sometimes things come to me. Sometimes these things are garbage. Sometimes they’re insights. I’m not sure which category this taxonomy fits into, but it represents a very abstract overview for the next section of my Ed.D. thesis… :-p
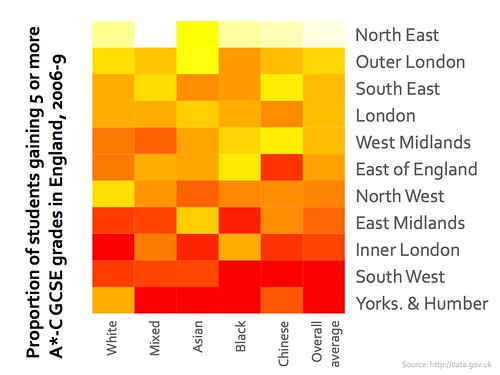
The consistently helpful Nathan Yau at FlowingData posted a brief tutorial this week on how to make heatmaps quickly. I had a play given that the UK government launched the surprisingly useful and well thought-out data.gov.uk recently!
Here’s what I came up with:
(yes, I too was surprised that the North East leads the way in number of students gaining 5 or more A*-Cs!) :-p
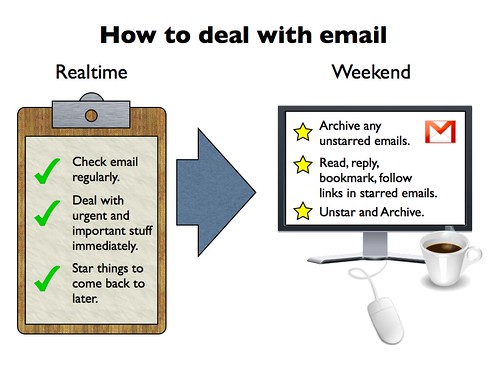
I get quite a bit of email. Even more, now that I’ve pretty much abandoned RSS and subscribed to news sources and blogs via email.* There’s various approaches to dealing with email (e.g.s – Inbox Zero, GTD, etc.) but, for what it’s worth, here’s my ‘system’. I haven’t read or watched videos of the others – they may be similar, they may not. My system (if I can call it that) depends on a GMail-like ‘star’ feature, so may not be useful for everyone:
* Why don’t I use an RSS feed reader much any more? Getting update via email forces me (under the system outlined above) to read new stuff at least once a week. It’s also rather depressing when you see you’ve got literally thousands of unread items in your feed reader… :-p