
GCSE results by location/ethnicity [visualization]
The consistently helpful Nathan Yau at FlowingData posted a brief tutorial this week on how to make heatmaps quickly. I had a play given that the UK government launched the surprisingly useful and well thought-out data.gov.uk recently!
Here’s what I came up with:
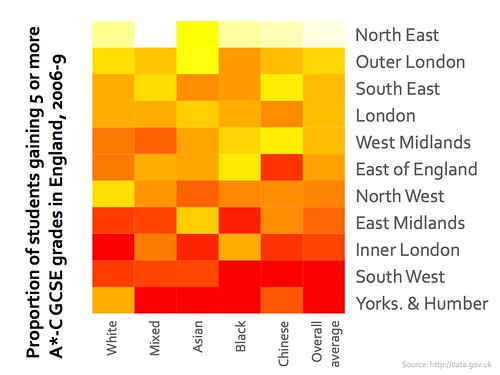
(yes, I too was surprised that the North East leads the way in number of students gaining 5 or more A*-Cs!) :-p