Open Thinkering

Menu

Tag: system map

TB872: Identifying elements and processes of social learning

Note: this is a post reflecting on one of the modules of my MSc in Systems Thinking in Practice. You can see all of the related posts in this category.


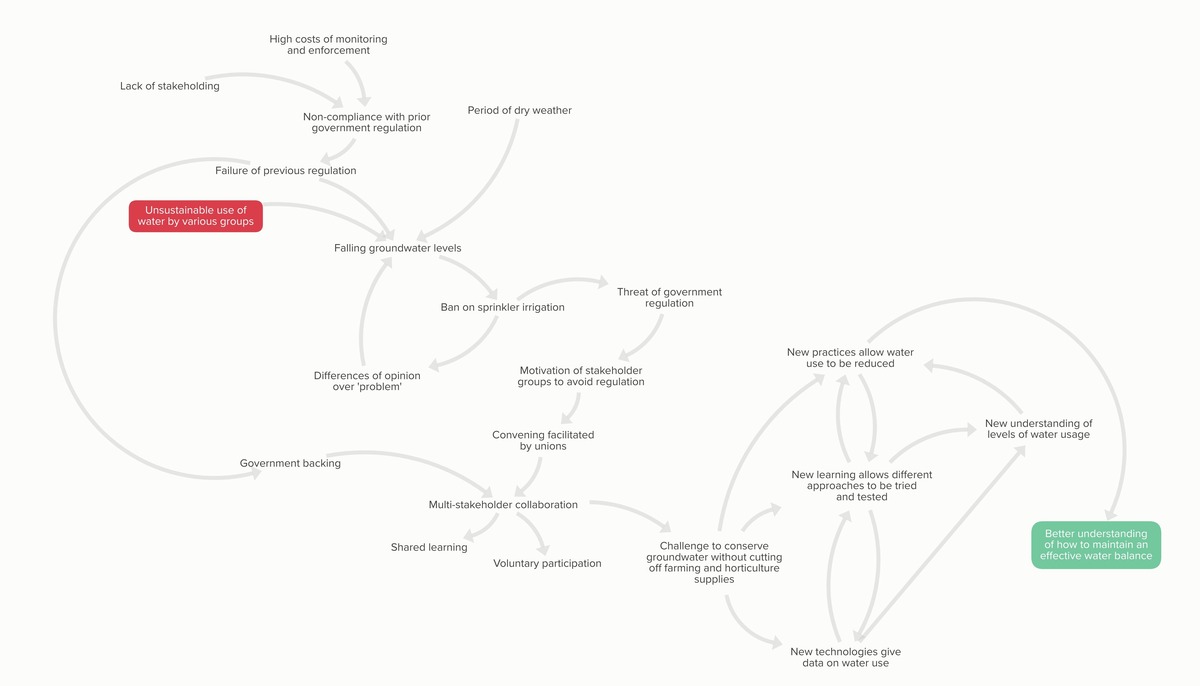
(tap on image to enlarge)

One of the things I’m keen to get better at during this course is the diagrams that make Systems Thinking seem like some kind of magic. The one I’ve produced above, using Kumu, is pretty basic, and is prompted by the following text from the course materials:

In 2003 water boards in the Benelux middle area (BMG) in the Netherlands imposed a ban on sprinkler irrigation when groundwater levels fell during a period of dry weather. Among the many stakeholders in this situation besides the water boards, were farmers, horticulturalists, conservationists and individual members of the public. While the sprinkler ban provided one solution, these stakeholders all articulated ‘the problem’ in different ways – several systems of interest were apparent. The challenge was for stakeholders to act together in a way that conserved groundwater without cutting off essential supplies for farming and horticulture. With the help of a farmers and horticulturalists’ union, a proactive multi-stakeholder collaboration, based on shared learning and voluntary participation, was formed that worked in awareness that the authorities could intervene if voluntary effort proved insufficient. Government backed this development, as past regulation had failed to improve the situation due to the high costs of monitoring and enforcement and non-compliance with the regulation, probably because of lack of stakeholding. Together those concerned learnt how to use their sprinkler irrigation more efficiently by using new technologies and practices such as micro-weirs and meters and a feedback process so farmers could see how much water they were using and understand better how to maintain an effective water balance.

Adapted from Jiggins et al., 2007

Although there’s no ‘right’ or ‘wrong’ way of doing these per se, I had to look at the course author’s version to take a few pointers.

My method was essentially:

  • Read the text for understanding
  • Read again and pull out key points onto the digital canvas in Kumu
  • Add anything that is implied (e.g. motivations)
  • Start drawing arrows
  • Organise boxes
  • Add colour

I’m looking forward to doing a lot more of these in the weeks and months to come!

TB872: Mapping my arrival trajectory

Note: this is a post reflecting on one of the modules of my MSc in Systems Thinking in Practice. You can see all of the related posts in this category.


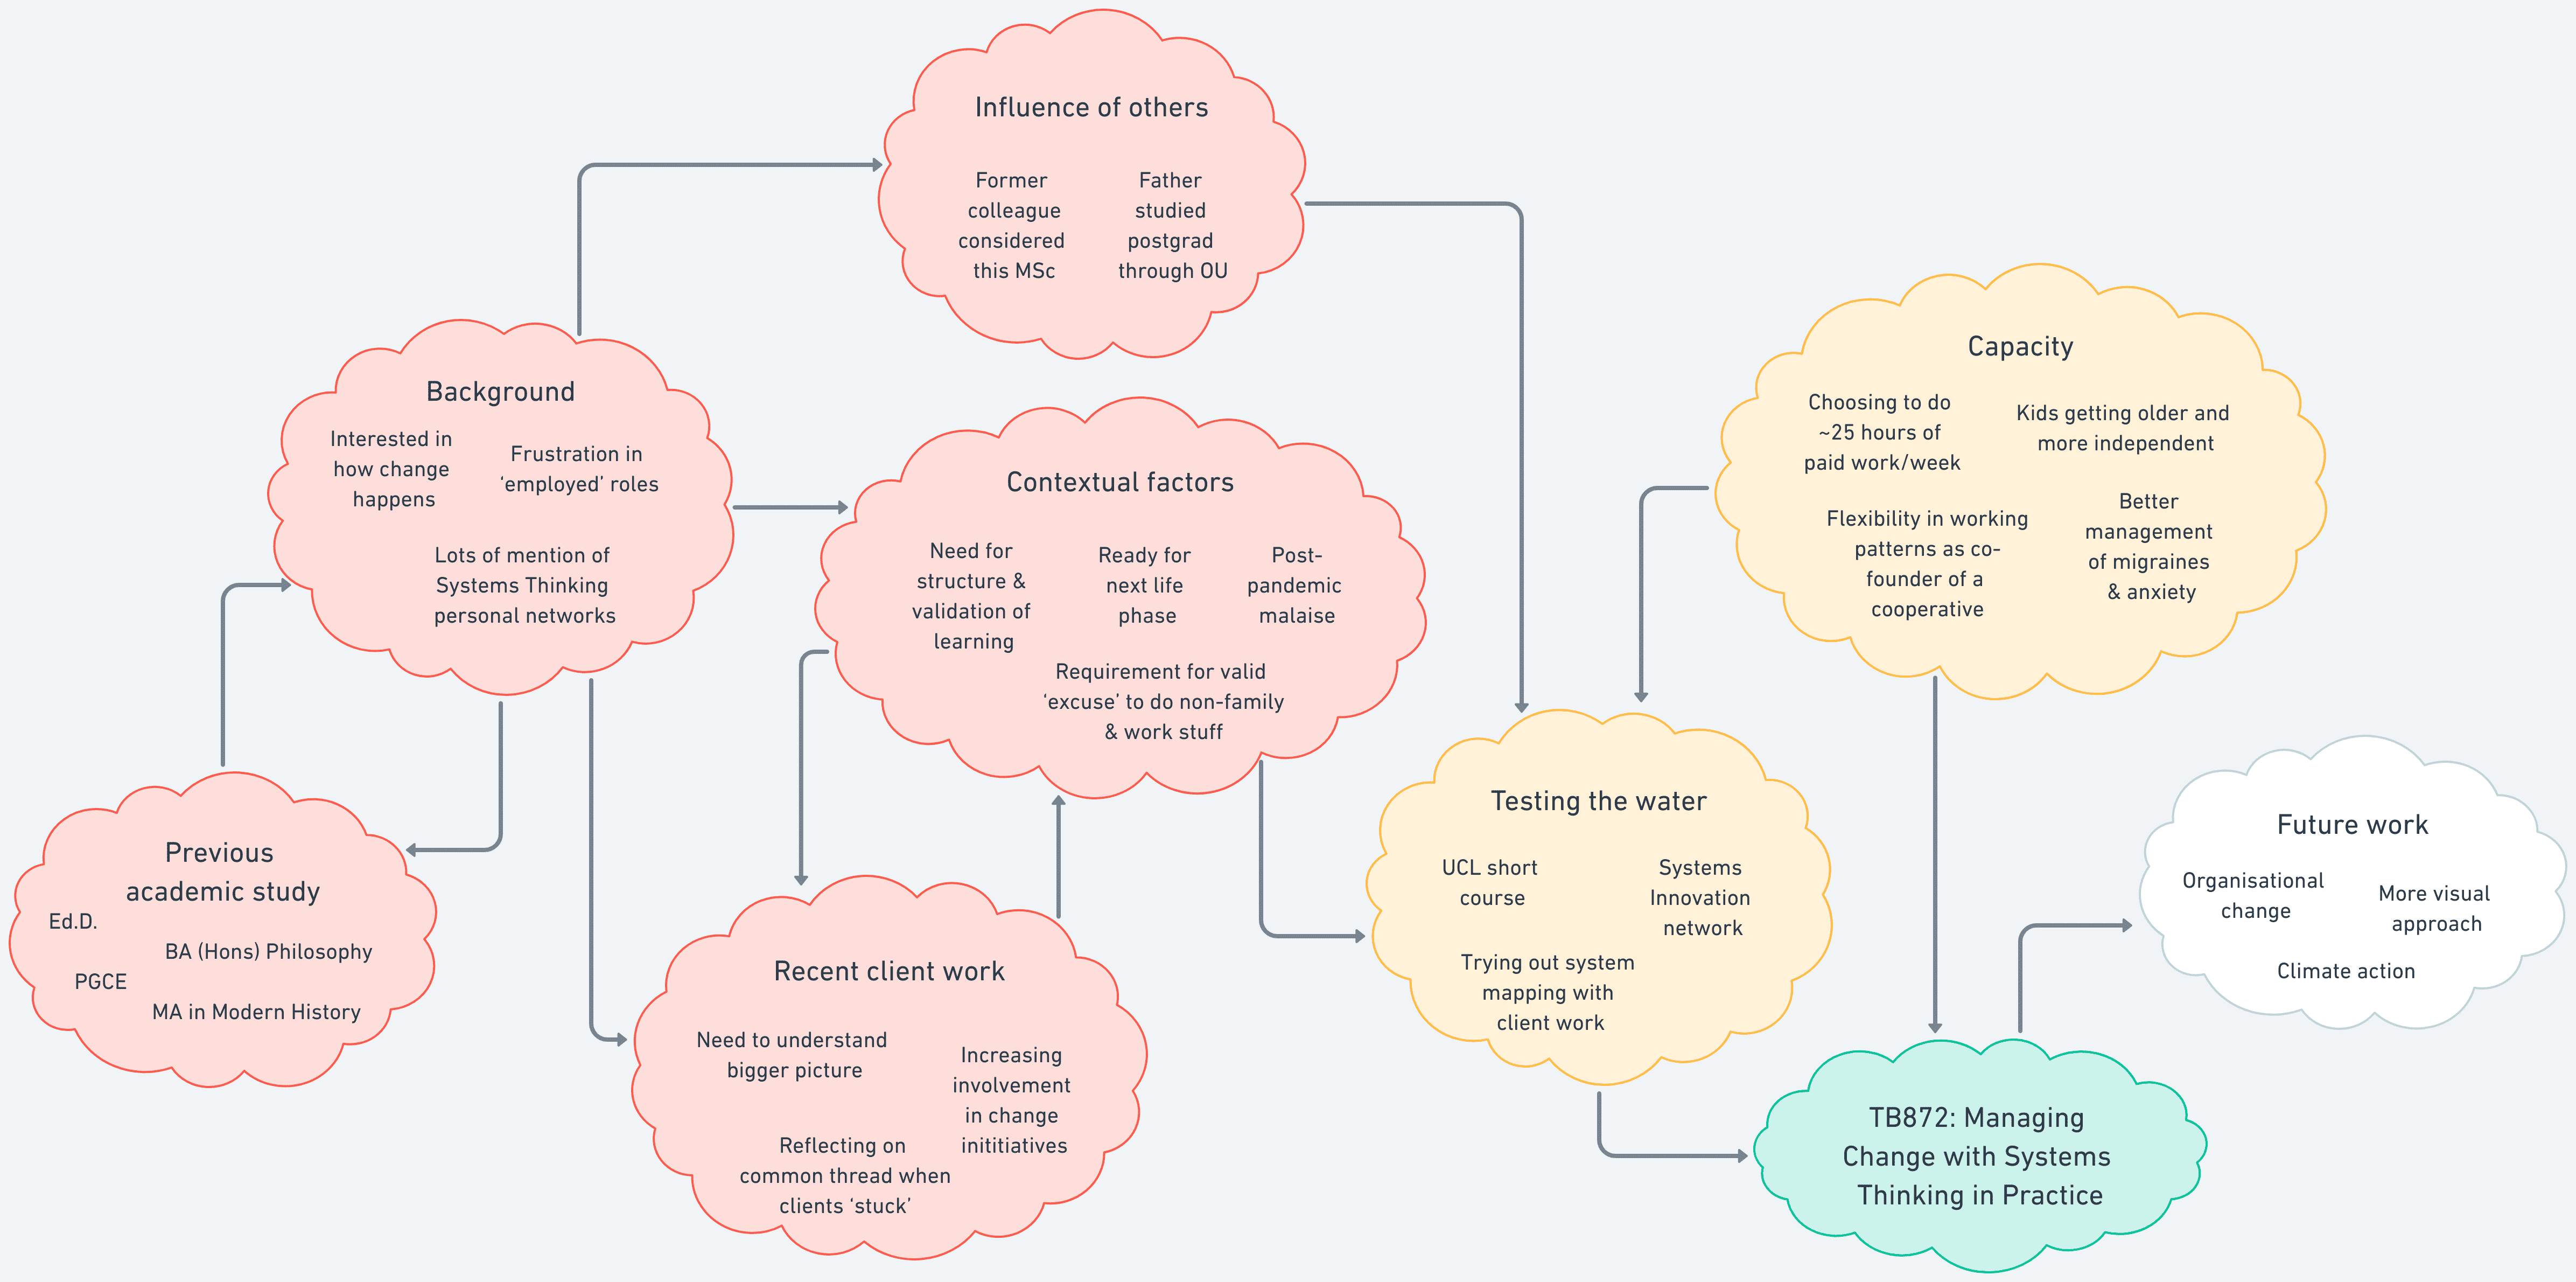
Doug's trajectory map with blobs (elements) and information about background, context, capacity, etc.

(click to enlarge)

The above diagram is a ‘trajectory map’ showing my arrival at module TB872: Managing Change with Systems Thinking in Practice. The approach comes from Etienne Wenger’s work around communities of practice to help them understand their identities in relation to others, as well as their past, present, and future trajectory.

[Trajectories] give significance to events in relation to time construed as an extension of the self. They provide a context in which to determine what, among all the things that are potentially significant, actually becomes significant learning. A sense of trajectory gives us ways of sorting out what matters and what does not, what contributes to our identity and what remains marginal.

(Wenger, 1998, p. 155, cited in TB872 module guide)

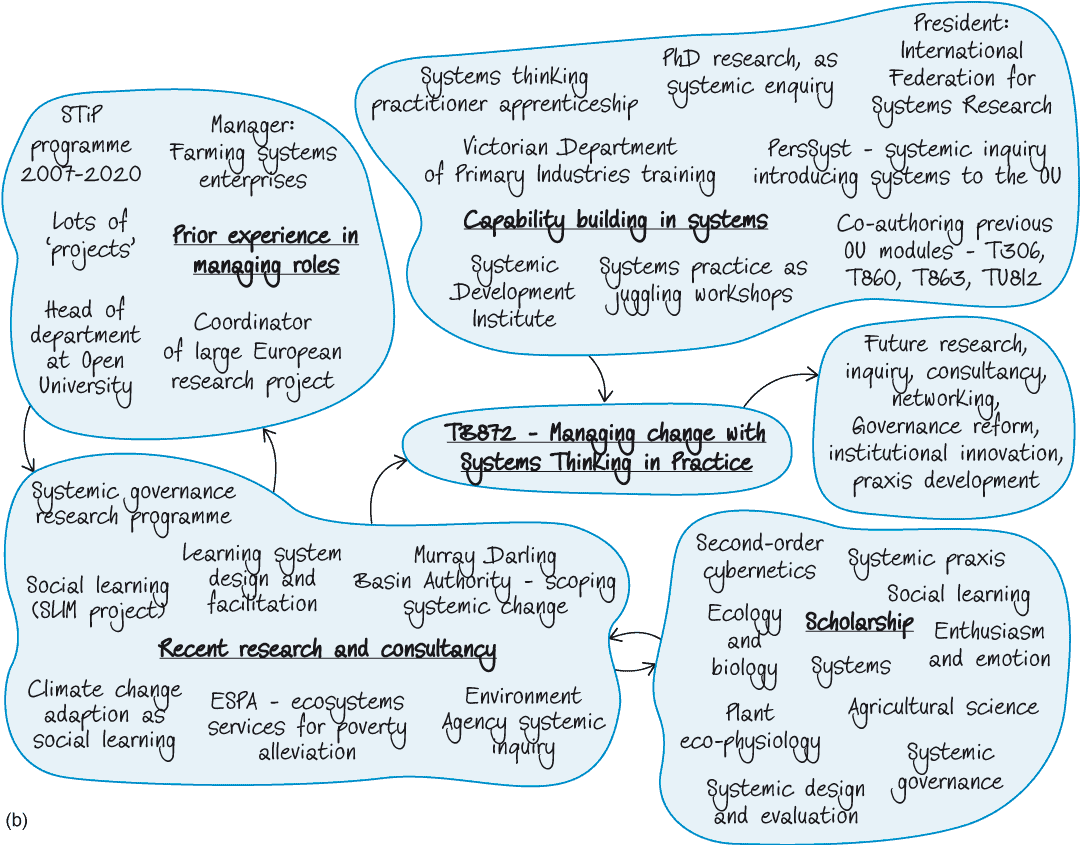
There were two examples given to us, one of which you can see below:

Example trajectory map (Ray Ison)

You may think that mine doesn’t look much like the example, and you’d be correct. However, I have a preference for using digital tools and so used Whimsical again. I initially tried Kumu, but couldn’t find an adequate way to represent what I wanted to include.

What is similar are the ‘blobs’ containing information, and the causal arrows pointing to and from each of them. I reorganised my trajectory map after I read that it should have a ‘temporal flow’ to it. In other words, it should be easy for the reader/viewer to understand the order in which things happened. In my case, it reads mainly left to right and top to bottom.

I found this relatively straightforward to do, as I didn’t stumble into this module but had thought carefully about what I wanted to do and why. For example, I had reflected that in the second half of my career I wanted to work on finding leverage points to effect change at scale. Systems Thinking seemed to be a good way of doing this, and fitted with my interests. I looked at the Masters-level courses available and rejected Cranfield’s MSc as it seemed too technology-focused. Likewise, although I enjoyed the UCL Short Course in Systems Thinking that I tried, it was again too technically-minded.

My aim is to use my background in the humanities to think much more on the human side of things. I’ve worked with the Open University before, and my dad loved his postgraduate studies through the OU when I was growing up. It seemed a good, flexible option, and I haven’t been proved wrong so far!

TB872: creating a systems map of the module

Note: this is a post reflecting on one of the modules of my MSc in Systems Thinking in Practice. You can see all of the related posts in this category.

One of the activities for me to complete in this first week of TB872 (Managing change with systems thinking in practice) is to create a system map of the module. In the guidance, it’s recommended that you draw it.

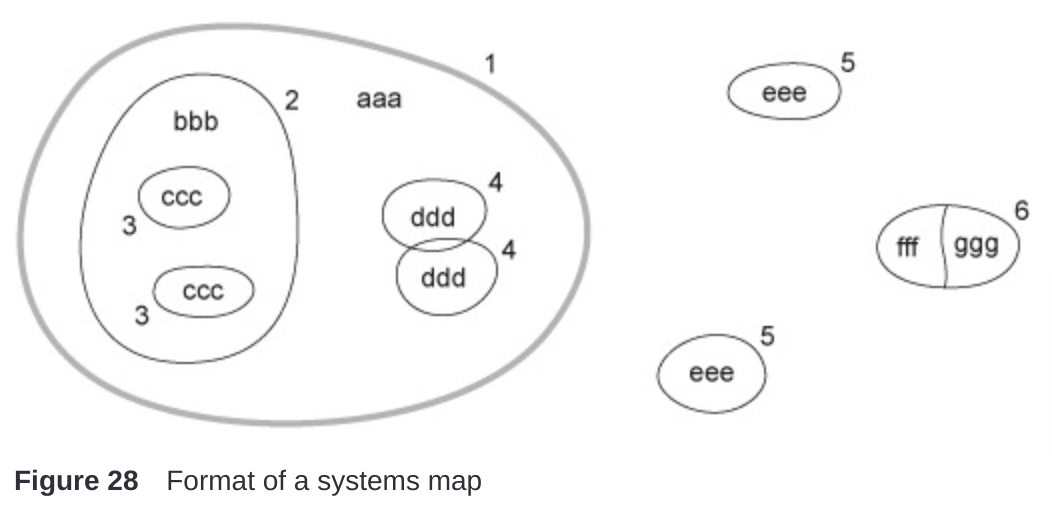
This systems map layout consists of numbered circles and labels. Inside a large circle numbered 1, is the label aaa and smaller circles. One circle numbered 2 contains the label bbb and two circles numbered 3 and labelled ccc. Inside the large circle 1 are two overlapping circles numbered 4 and labelled ddd.

Outside the large circle are two circles numbered 5 and labelled eee. A circle numbered 6 has a split through the middle, with one side labelled fff and the other ggg.

Irregular blobs are normally preferable to regular boxes. Boxes imply that (sub-) systems are clearly defined, which is seldom the case, and have the practical disadvantage that the eye finds it hard to distinguish between a series of parallel lines.

This is all well and good, but I didn’t bring a pen with me to the library, and trying to draw with my finger on the touchscreen of my laptop ended in abject failure. So I decided to use a tool with which I’m familiar, Whimsical which I use every week for client work through WAO.

Conventions

  • The lines around the blobs (1–6 in Figure 28) represent boundaries of system components.
  • Words (e.g. aaa, bbb, ccc) are used to name each system or component.
  • Blobs (5 and 6) outside the main system boundary (1) represent components of the environment.
  • Blobs (2, 3 and 4) inside the system boundary (1) represent components of the system. Components (e.g. 3) can be shown as grouped into subsystems (2).
  • Blobs may overlap only if some components (which need not be depicted) are clearly common to both.

Arrows are not permitted on systems maps, apparently.

With that in mind, here’s what I produced (tap to enlarge)

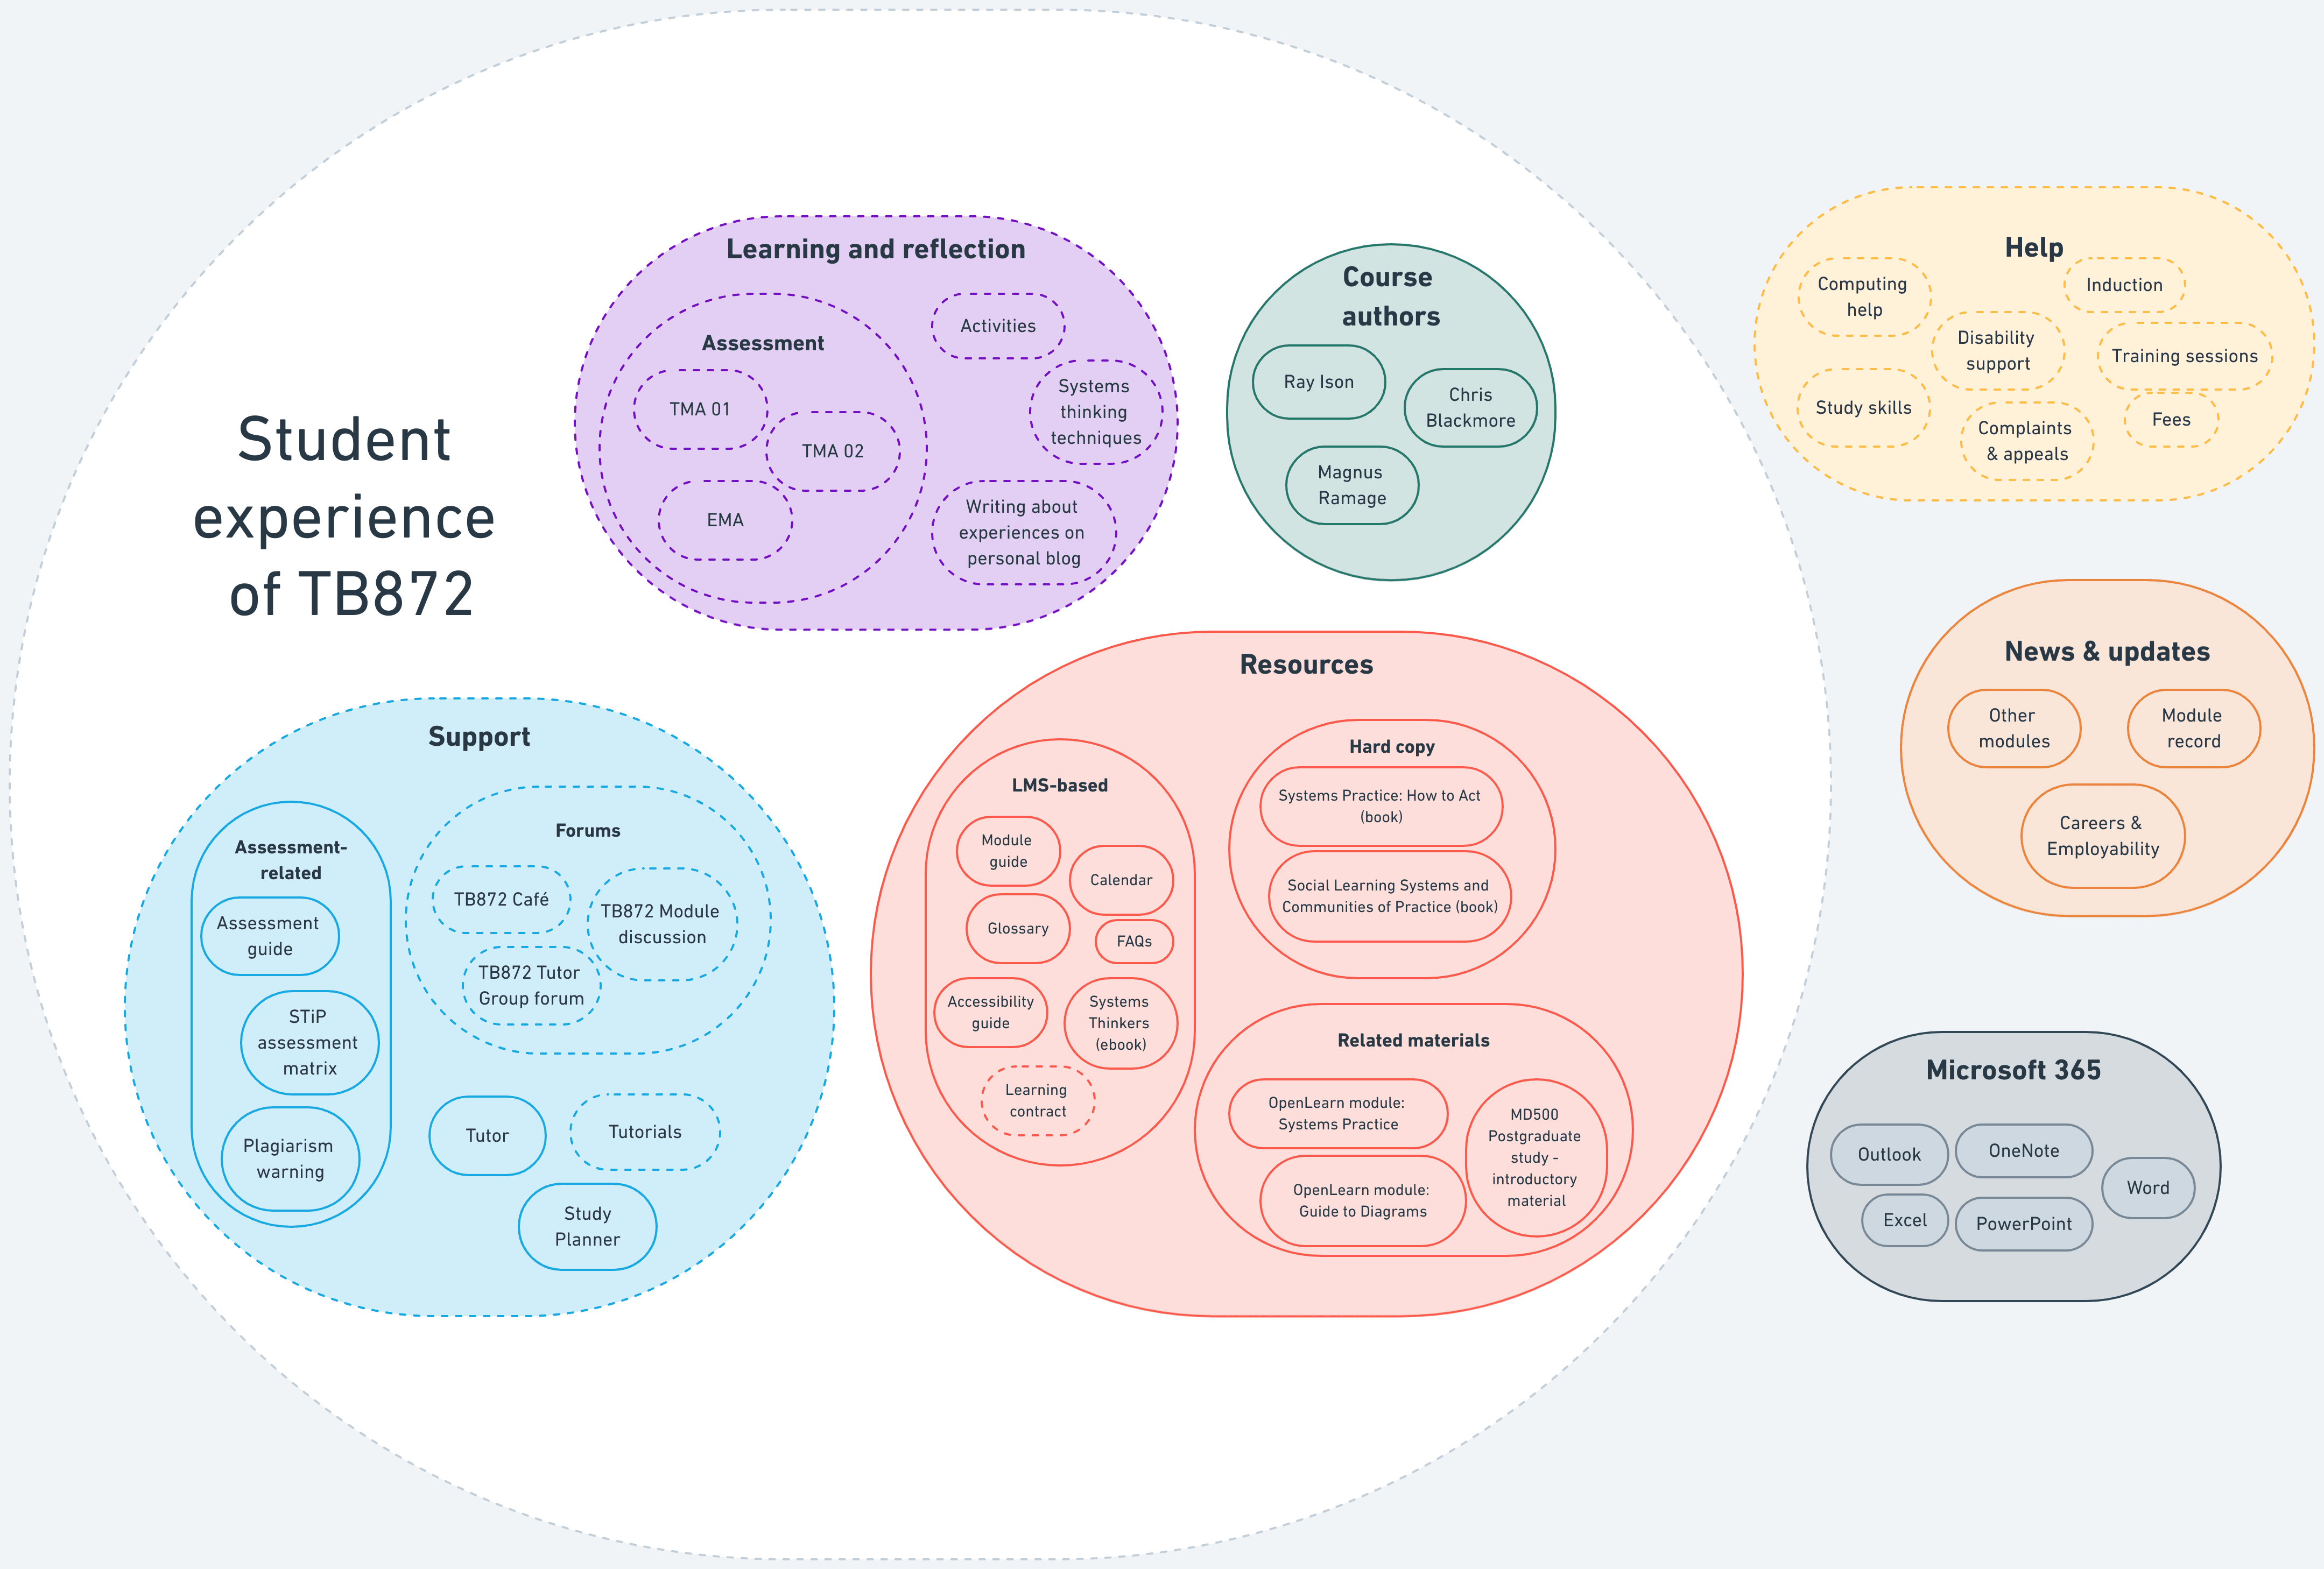
System map entitled 'Student experience of TB872' with blobs named 'Learning and reflection', 'Course authors', 'Support', and 'Resources'. There are other blobs outside the boundary named 'Help', 'News & updates' and 'Microsoft 365'

I decided that the boundary was my experience of the module. I wrote down all of the elements, and decided to what extent I they were either:

  1. Presented to me ‘as-is’ (hard line)
  2. Presented to me in a way in which I could modify (dotted line)

I should probably explain the diagram a bit:

  • Wider university updates sit outside of the boundary of the TB872 module.
  • I see assessment as part of learning and reflection, which is why it’s situated where it is.
  • Human interactions on this module seem to be limited to my tutor and other students. The course authors ‘present’ information to me which I consume asynchronously, hence the hard line.
  • I have no intention of using Microsoft tools, so they’re sitting firmly outside of my experience of TB872 (and therefore the system boundary)
  • The learning materials themselves aren’t modifiable by me, so they all have a hard line around them, except the learning contract (which I presume is for a future activity)

Hopefully, the rest is somewhat self-explanatory.


Next up is a trajectory diagram of how I arrived at the module. I’m aiming to get that done later today or over the weekend!

css.php