Open Thinkering

Menu

Tag: Netherlands

TB872: Identifying elements and processes of social learning

Note: this is a post reflecting on one of the modules of my MSc in Systems Thinking in Practice. You can see all of the related posts in this category.


(tap on image to enlarge)

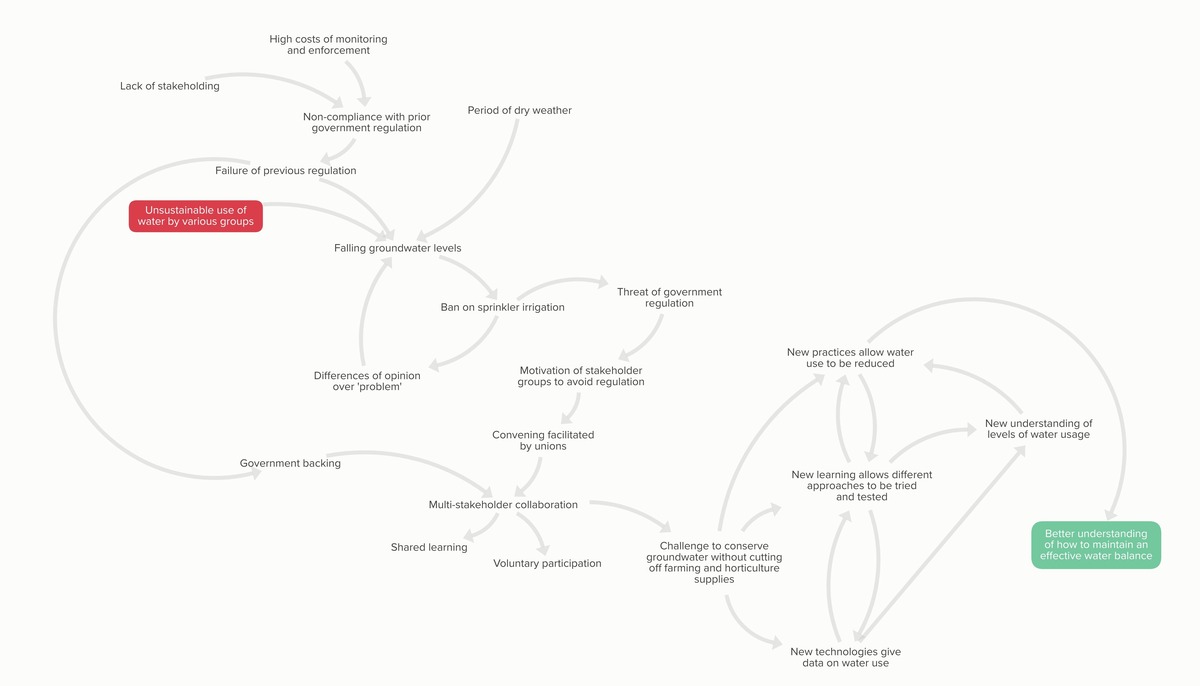
One of the things I’m keen to get better at during this course is the diagrams that make Systems Thinking seem like some kind of magic. The one I’ve produced above, using Kumu, is pretty basic, and is prompted by the following text from the course materials:

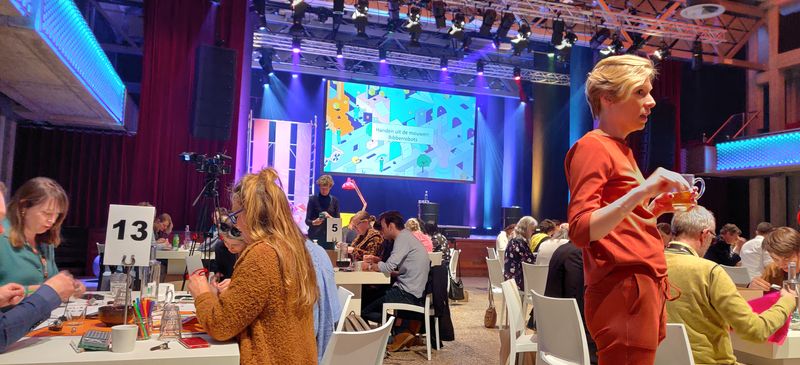
In 2003 water boards in the Benelux middle area (BMG) in the Netherlands imposed a ban on sprinkler irrigation when groundwater levels fell during a period of dry weather. Among the many stakeholders in this situation besides the water boards, were farmers, horticulturalists, conservationists and individual members of the public. While the sprinkler ban provided one solution, these stakeholders all articulated ‘the problem’ in different ways – several systems of interest were apparent. The challenge was for stakeholders to act together in a way that conserved groundwater without cutting off essential supplies for farming and horticulture. With the help of a farmers and horticulturalists’ union, a proactive multi-stakeholder collaboration, based on shared learning and voluntary participation, was formed that worked in awareness that the authorities could intervene if voluntary effort proved insufficient. Government backed this development, as past regulation had failed to improve the situation due to the high costs of monitoring and enforcement and non-compliance with the regulation, probably because of lack of stakeholding. Together those concerned learnt how to use their sprinkler irrigation more efficiently by using new technologies and practices such as micro-weirs and meters and a feedback process so farmers could see how much water they were using and understand better how to maintain an effective water balance.

Adapted from Jiggins et al., 2007

Although there’s no ‘right’ or ‘wrong’ way of doing these per se, I had to look at the course author’s version to take a few pointers.

My method was essentially:

  • Read the text for understanding
  • Read again and pull out key points onto the digital canvas in Kumu
  • Add anything that is implied (e.g. motivations)
  • Start drawing arrows
  • Organise boxes
  • Add colour

I’m looking forward to doing a lot more of these in the weeks and months to come!

Weeknote 12/2022

I’ve spent most of this week in the Netherlands which, I have to say, seems like the grown-up and sophisticated cousin to the awkward teenager that is the (dis-)United Kingdom. Every country has its issues, but I’m always impressed when I come over here at how things are set up to empower citizens.

To labour the point just a little, here’s a graphic shared by Andrew Curry in his excellent daily newsletter on Tuesday. A picture, as they say, paints a thousand words. And you don’t get into this situation without a decade’s absolute failure of governmental policy.

Map showing the 10 poorest areas in northern Europe. Nine of them are in the UK. 'Inner London' is the richest.

I often say that “London is a different country”. This map helps illustrate my point, as it’s the wealthiest place in northern Europe while other parts of the UK suffer. One of the reasons we have such a broken society is precisely because of the glaring wealth inequality between regions.

I shall gently dismount my hobby horse now…


After a wonderful weekend with my wife, Hannah, and dinner with Laura and her husband, I headed to Assen in the north of the Netherlands on Monday. There, on Tuesday, I was part of the first day of the Dutch National Libraries conference. The session went OK, but I wasn’t happy with the structure of it (I talk then they do a task) nor with the type of examples I was giving (too general).

The Dutch Libraries Conference in Amersfoort.

As a result, I completely overhauled my slide deck and the structure of the session for Wednesday in Eindhoven and Thursday in Amersfoort. You can see my slide deck here and the recordings should soon be available, which I shall add to my speaking page.

Amersfoort, in particular, is an absolutely lovely place. I was a walking 🤩 emoji as I wandered around, checking out the medieval town centre, including the Koppelpoort. At 150,000 people, it seems like a perfect size. I could imagine moving here if my fellow countrymen and women hadn’t voted for Brexit. (There is no emoji to express my sadness over this.)

Koppelpoort (combined land and water gate), Amersfoort

An added bonus was having dinner on Thursday night with Ton Zijlstra, his wife and daughter, as well as Jeroen de Boer (who was the one who invited me to the Netherlands. I then got a guided tour of Amersfoort from Ton on Friday, including a visit to the Mondriaanhuus.


Overall, it’s been a successful week and although I’m tired, I’m nowhere near as tired as I thought I would be. I managed to sneak in a couple of runs, as well as going to the gym at our hotel in Amsterdam. I’ve also started taking Feverfew tablets and, while I can’t absolutely prove a causal effect, I’ve had zero migraines in a week when I’d expect to have at least one.

I’ve published the following on Thought Shrapnel:


Today I’m assembling our second-ever bed in almost 19 years of marriage. It looks like it’s going to be a sunny weekend, so I may spend some of it gardening!

Next week I’m working on client projects as usual, before taking three weeks off. The week after next (which is the first week of April) I’m walking Hadrian’s Wall with Aaron. Then I’ve got a week to recover, tinker, sell things on eBay, and do a bit of DIY. The week after that, Team Belshaw is heading to Croatia on our first foreign holiday since Iceland in December 2019. I’m very much looking forward to those three weeks!

Open Badges is now on the plateau of productivity

Image aCC BY-SA Jeremy Kemp

Today I presented on a topic I’ve been presenting on for around 11 years now: Open Badges. I must have given 200 presentations on the subject, to audiences that number fewer than 10 to the several hundreds.

Over that time, the specification has changed, as have adoption rates, which have gone through the roof. Last year, I reflected in an article for the WAO blog that good things happen slowly, bad things happen fast. It’s taken a decade, as I predicted, for badges to be a no-brainer when it comes to recognising and credentialing knowledge, skills, and dispositions.

We’re no longer in the stage of “imagine a world…” but rather “here’s what’s happening, let’s talk about how this could be useful to you”. In other words, in the language of the Gartner hype cycle (to which I allude in the above post), we’re in the stage of ‘plateau of productivity’.

I recorded this Loom video to ensure I had the timing right for the 45 minute slot I’ve got. While I’m pretty good with timing, I use a lot of slides, and it’s been a couple of years since I presented in person!

I’ll also be throwing in a couple if interactive bits, so I need to ensure I don’t get stuck in the weeds with the inevitable questions about Blockchain / web3. My plan, as you can see in the recording below, is to point to v3.0 of the specification and talk about why decentralised identifiers (DiDs) are more exciting than blockchain, which I consider a back office technology.

So, without further ado, here’s a run-through of my presentation for FERS.

Next week I’ve been asked to speak at Het Nationale Bibliotheekcongres (the Dutch National Library conference) which is taking place in Assen, Eindhoven, and Amersfoort. I’ll be running a session fusing my badges work with digital literacies stuff in the service of discussing digital citizenship. Given than I’m only supposed to be talking for 15-20 mins before participants have 25-30 mins to do something, it’s going to be tight…

css.php