
TB872: creating a systems map of the module
Note: this is a post reflecting on one of the modules of my MSc in Systems Thinking in Practice. You can see all of the related posts in this category.
One of the activities for me to complete in this first week of TB872 (Managing change with systems thinking in practice) is to create a system map of the module. In the guidance, it’s recommended that you draw it.
Irregular blobs are normally preferable to regular boxes. Boxes imply that (sub-) systems are clearly defined, which is seldom the case, and have the practical disadvantage that the eye finds it hard to distinguish between a series of parallel lines.
This is all well and good, but I didn’t bring a pen with me to the library, and trying to draw with my finger on the touchscreen of my laptop ended in abject failure. So I decided to use a tool with which I’m familiar, Whimsical which I use every week for client work through WAO.
Conventions
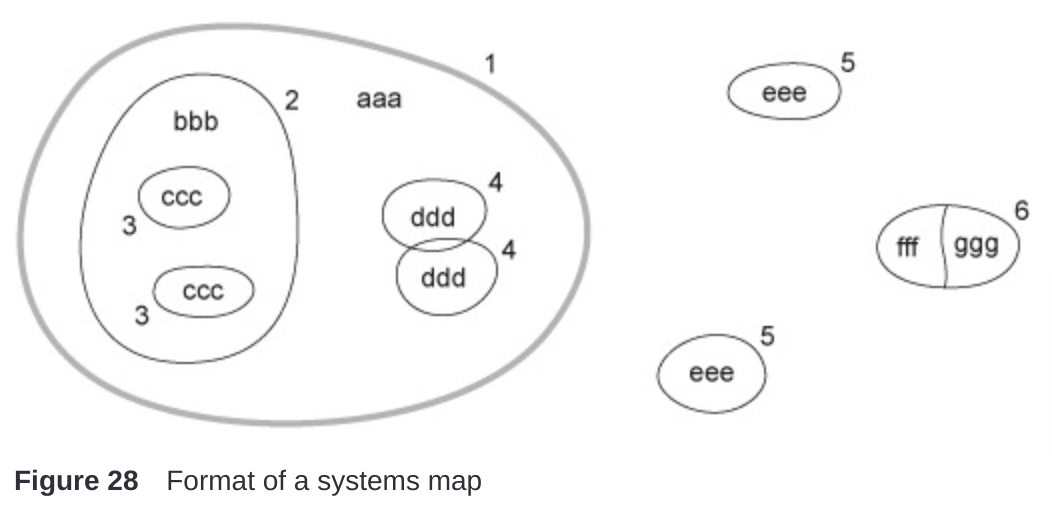
- The lines around the blobs (1–6 in Figure 28) represent boundaries of system components.
- Words (e.g. aaa, bbb, ccc) are used to name each system or component.
- Blobs (5 and 6) outside the main system boundary (1) represent components of the environment.
- Blobs (2, 3 and 4) inside the system boundary (1) represent components of the system. Components (e.g. 3) can be shown as grouped into subsystems (2).
- Blobs may overlap only if some components (which need not be depicted) are clearly common to both.
Arrows are not permitted on systems maps, apparently.
With that in mind, here’s what I produced (tap to enlarge)
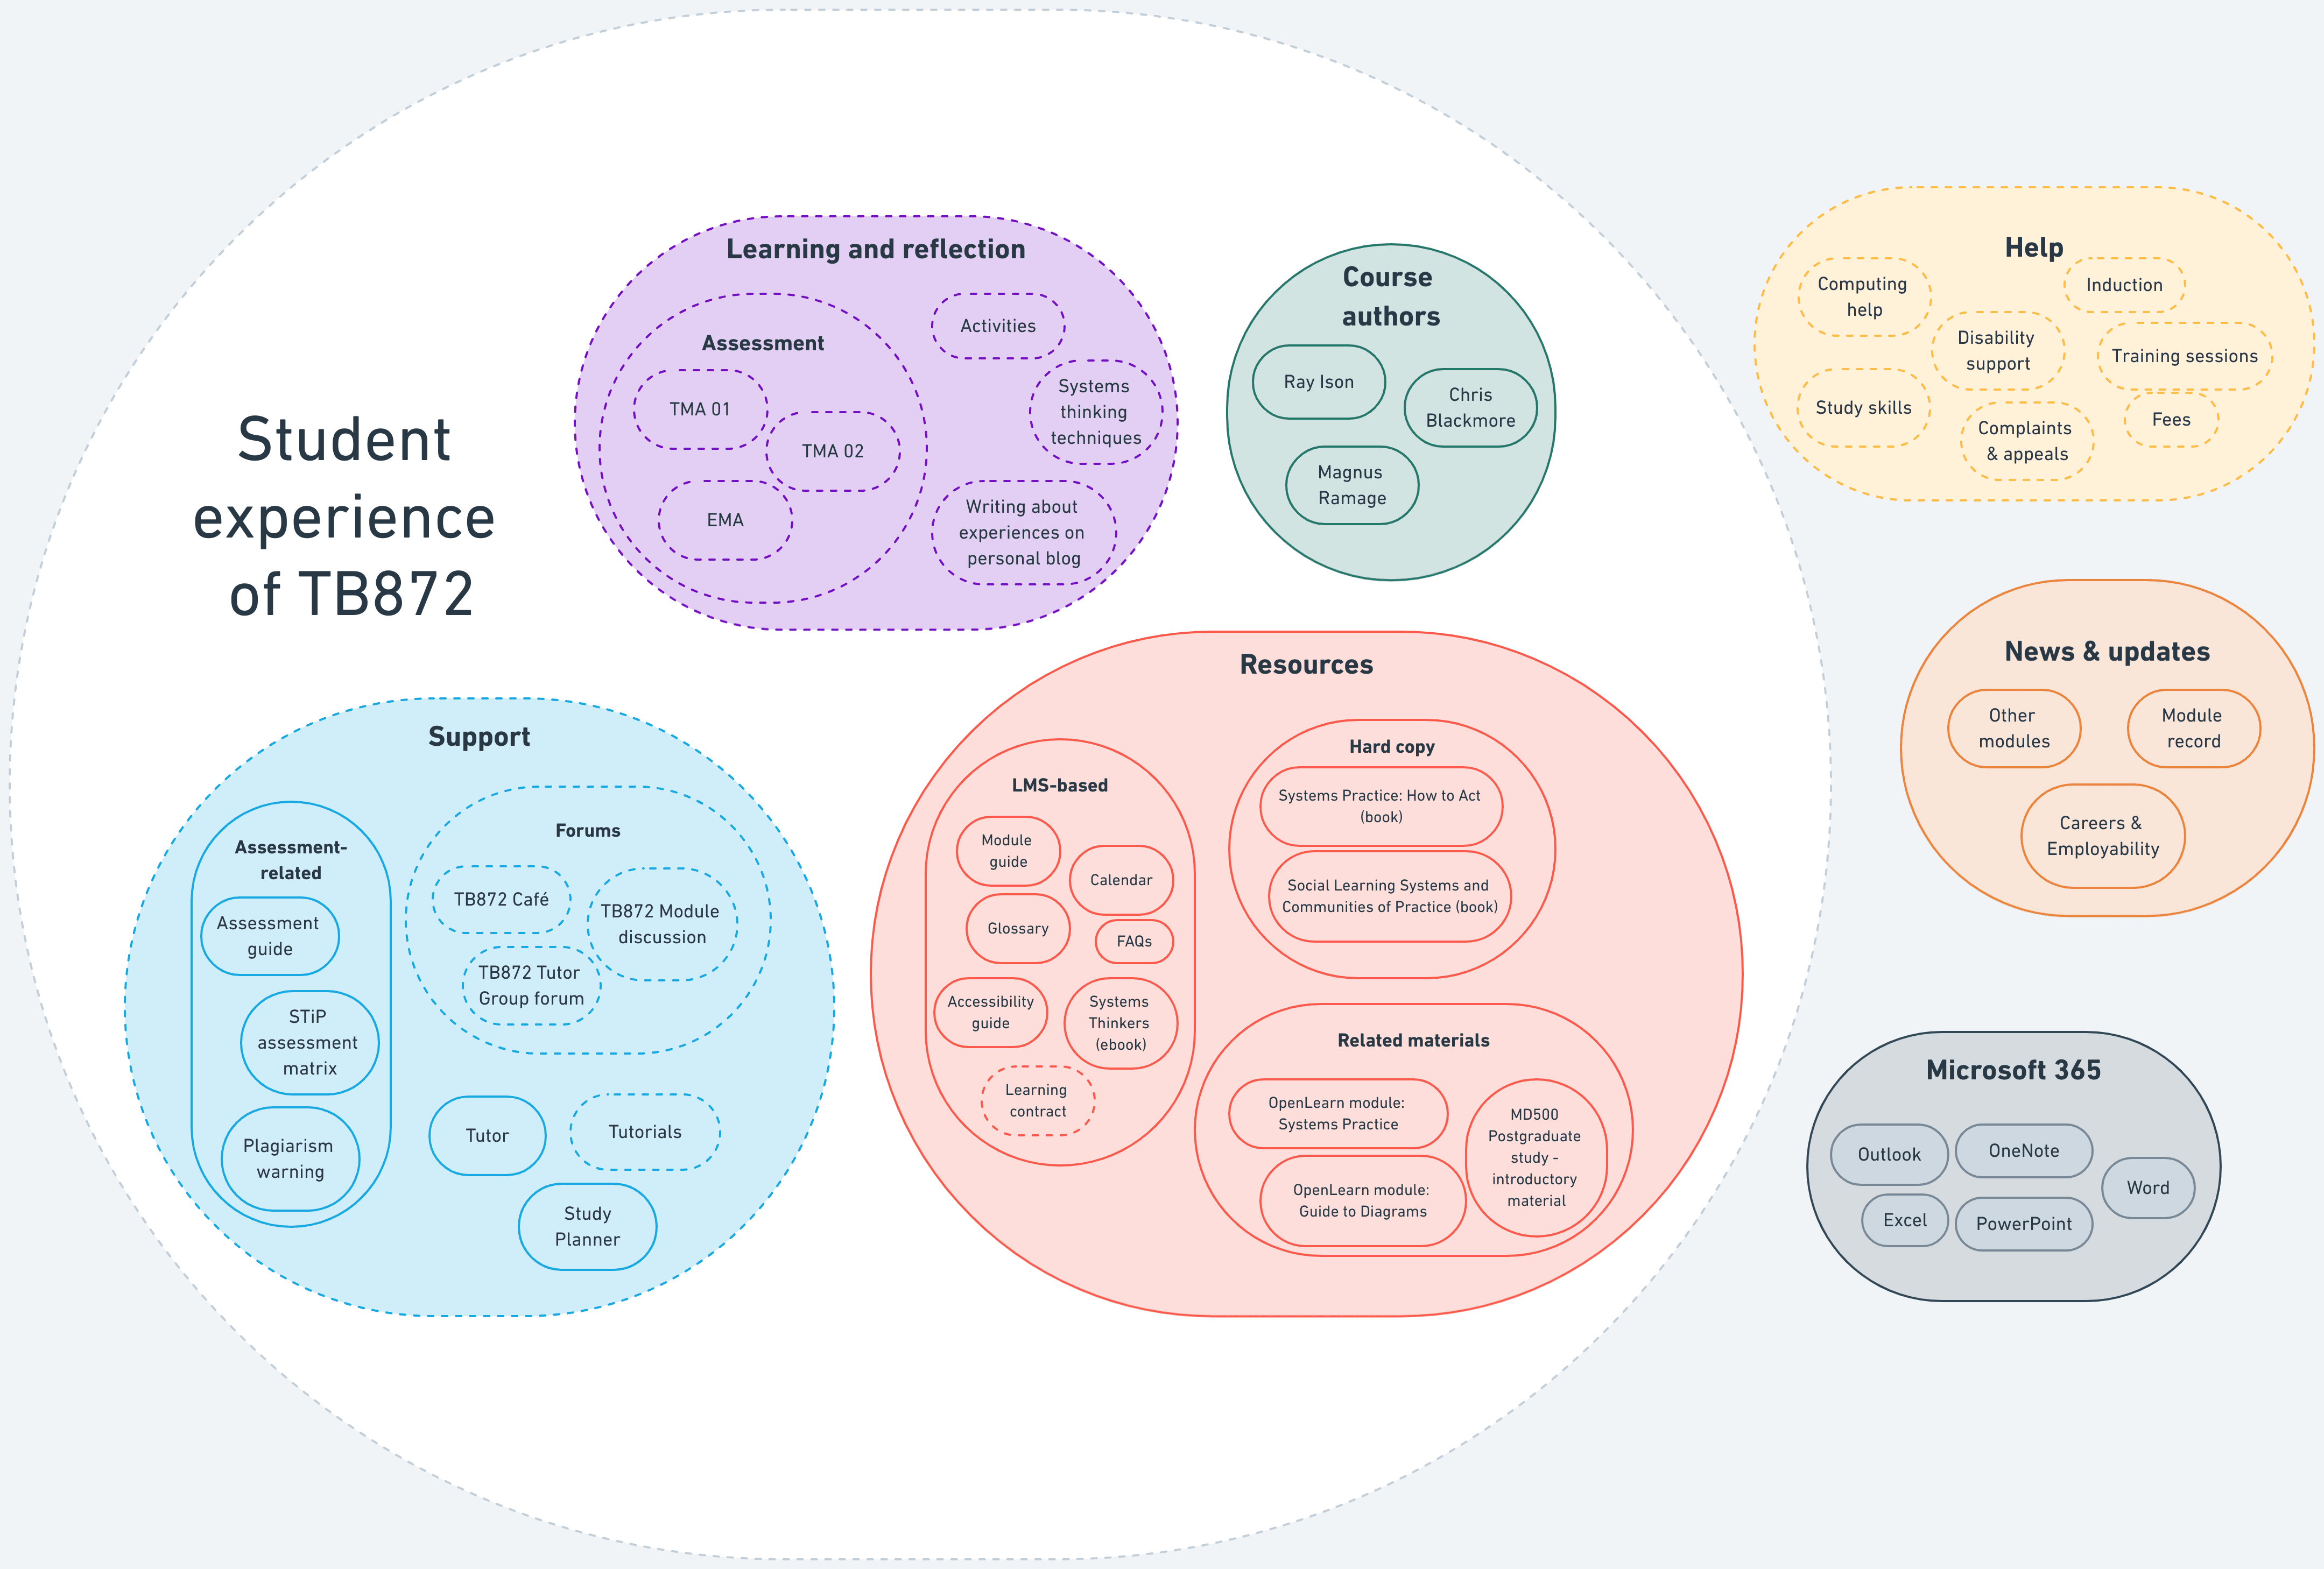
I decided that the boundary was my experience of the module. I wrote down all of the elements, and decided to what extent I they were either:
- Presented to me ‘as-is’ (hard line)
- Presented to me in a way in which I could modify (dotted line)
I should probably explain the diagram a bit:
- Wider university updates sit outside of the boundary of the TB872 module.
- I see assessment as part of learning and reflection, which is why it’s situated where it is.
- Human interactions on this module seem to be limited to my tutor and other students. The course authors ‘present’ information to me which I consume asynchronously, hence the hard line.
- I have no intention of using Microsoft tools, so they’re sitting firmly outside of my experience of TB872 (and therefore the system boundary)
- The learning materials themselves aren’t modifiable by me, so they all have a hard line around them, except the learning contract (which I presume is for a future activity)
Hopefully, the rest is somewhat self-explanatory.
Next up is a trajectory diagram of how I arrived at the module. I’m aiming to get that done later today or over the weekend!
When using system maps boundaries are always shown as being fluid. And depending on ones perspective a sub system can belong to more than one system or sub system. System maps do not neatly fit together like pieces of a jog saw puzzle.