Experience, skill, and user experience.
It’s amazing that, despite her stopping blogging over 3 years ago, I still use examples and graphs created by Kathy Sierra. She was that good.
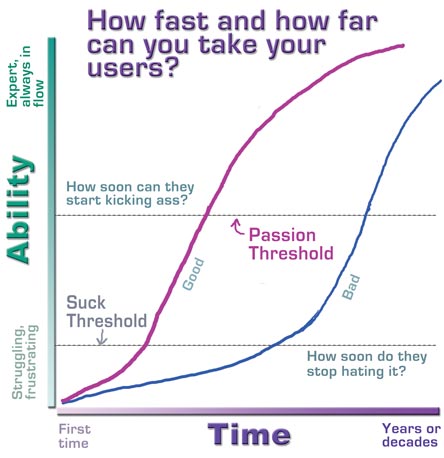
I played golf for only the second time in my life today. I suck at golf. I suck at golf because I don’t particularly like it, but more importantly have no reason to invest time in it. I played today to spend time with my Dad who spends most of his time living in a far-off land. Looking at the above graph shows that the main problem I have with golf that there’s too much time between me taking it up and kicking ass.
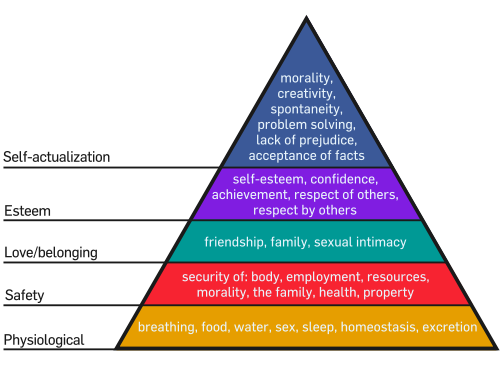
The 10,000 hours thesis put forward by Malcolm Gladwell in Outliers is that it takes around that amount of time to become ‘expert’ at something and achieve success. But there has to be a reason behind the commitment to put all that time in. In all probability it all boils down to Maslow’s hierarchy of needs:
 Nick Dennis was explaining to me recently how Bill Gates showed tremendous dedication to put in his 10,000 hours whilst still a teenager. However, he was also given a massive chance in life by his school being one of only a handful to have a computer at a time when even some universities didn’t have them.
So one take-away from this post would be to stick with what you’re both good at and interested in. The other would be to identify what benefits you’ve been afforded by your circumstances, and start practising.

