TB871: Vicious cycles and causal loops
Note: this is a post reflecting on one of the modules of my MSc in Systems Thinking in Practice. You can see all of the related posts in this category.
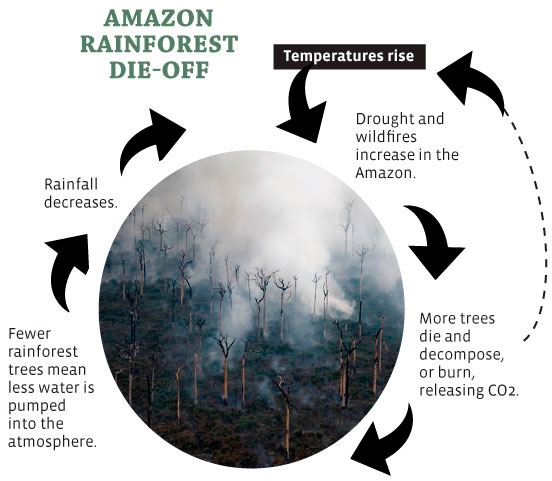
Activity 2.14 asks us to take the following diagram and create two separate causal loop diagrams signalling the ‘vicious cycles’:
![A circular diagram titled "AMAZON RAINFOREST DIE-OFF" explains the cycle of degradation with a central image of a burnt forest and surrounding text indicating escalating environmental damage due to rising temperatures, increased wildfires, tree deaths, and decreased rainfall.](https://dougbelshaw.com/blog/wp-content/uploads/2024/05/tb871_blk_02_ts_act_02_14_f03.tif.jpg)
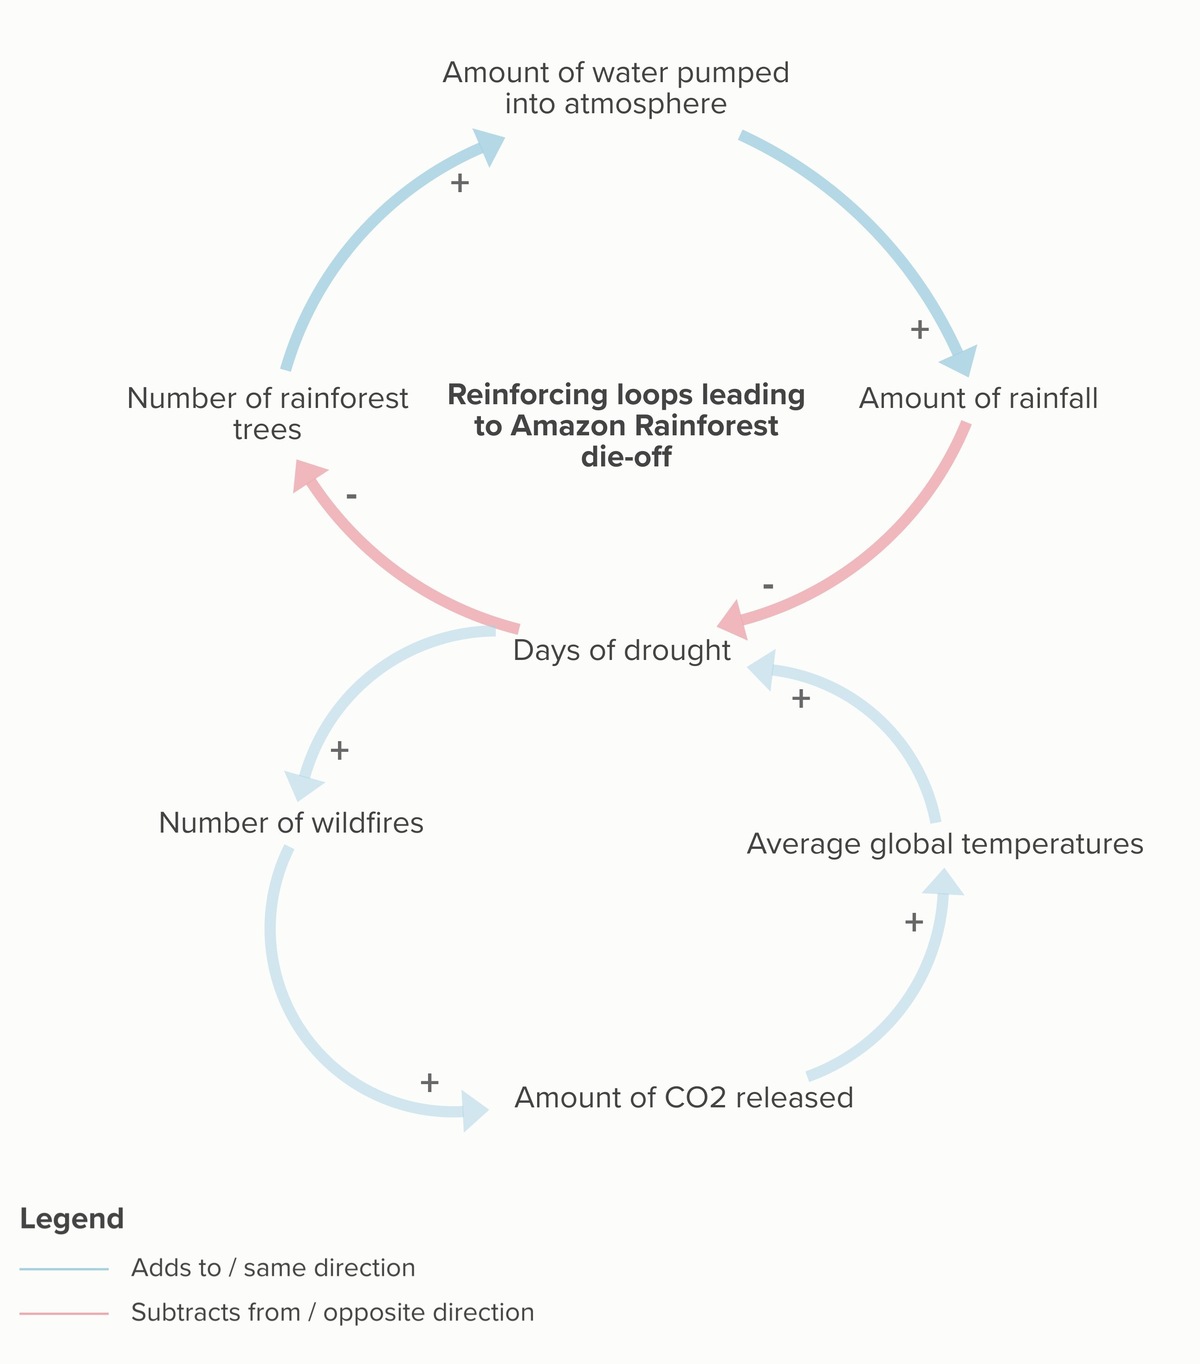
I had a quick look at the ‘answer’ after creating my two loops below, and they’re presented separately. But I still prefer my version:
![Causal loop diagram. First loop showing reduction in number of trees leads to less water in air, and less rainfall, leading to drought, and so fewer trees.
Second loop shows days of drought leading to increased number of wildfires, which releases more CO2, and therefore increases average global temperatures, and therefore increases the number of days of drought.](https://dougbelshaw.com/blog/wp-content/uploads/2024/05/rainforest-die-off.jpeg)
References
- The Open University (2020) ‘2.2.5 Understanding vicious and virtuous cycles’, TB871 Block 2 Tools Stream [Online]. Available at https://learn2.open.ac.uk/mod/oucontent/view.php?id=2261481§ion=3.5 (Accessed 26 May 2024).