
Web apps and workflows
The JISC infoNet team of which I am part are presenting at the Support Northumbria conference next month. We’re presenting a smorgasbord of delights for delegates with my part focusing upon workflows.
We’ve done plenty of work as a team on mapping our workflows but, given the fast-paced world we work in, I’ve not thought through mine as a researcher for a while. I decided to break out the crayons this afternoon, therefore, and think through both what I’m currently doing and how I can make that process more effective.
The first thing I did was to create four columns, reflecting what I consider to be the stages of research I go through:
- Inputs
- Lenses
- Curation
- Synthesis
Once I’d done that I placed every web app I use regularly into one of the columns (or ‘other’) and then identified which are core to my productivity. Then I thought how they fit together and how I could hone my workflow. I came up with this:
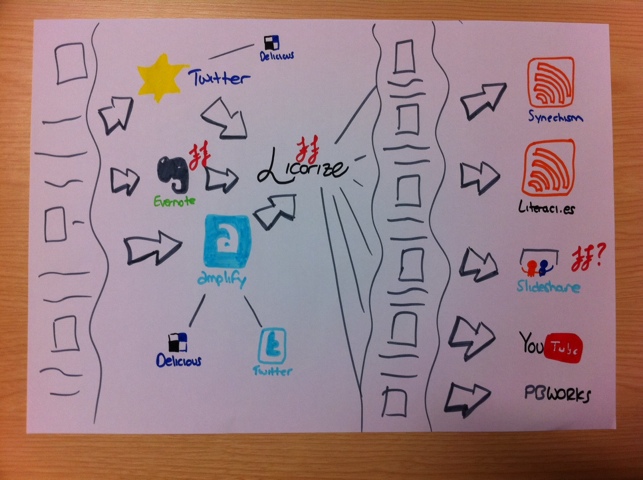
The grey river thing to the left stands for sources of information whilst the one in the middle for projects (current and potential).
I’ll no doubt have missed out something huge, but it was an interesting process to go through. I realised, for example, that I need to pay for Evernote on a yearly basis (I’ve been paying on an ad-hoc monthly basis) and use it more consistently. Also, I hadn’t carried out the very simple step of auto-feeding my Amplify RSS into Licorize as I had done with my starred twitter items!


